Part:BBa_K1184000:Experience
This experience page is provided so that any user may enter their experience using this part.
Please enter
how you used this part and how it worked out.
Applications of BBa_K1184000
User Reviews
UNIQ08d93e82984f9b20-partinfo-00000000-QINU
|
•••
Carnegie_Mellon 2013 |
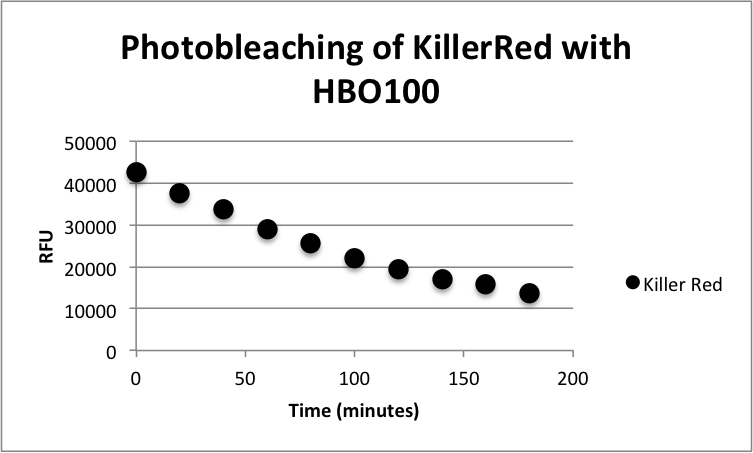
 Figure 1: Phototoxicity of KillerRed and mRFP1 (BBa_E1010) on E. coli XL10 by irradiating with a HBO100 lamp (includes 375 nm LP filter) for 5 hours. KillerRed's phototoxic effect on E. coli XL10 is shown in Figure 1. XL10 Ultracompetent cells were transformed with BBa_K1184000 cloned with BBa_B0034 as the RBS and BBa_R0010 as the wild-type lac promoter and induced overnight with IPTG.The overnight was bleached for 180 minutes with HBO100 (100W Mercury-arc lamp). Fluorescence data was taken using a Tecan Safire II with the parameters shown in Table 1. Fluorescence Data is shown in Table 2.
|
12 μW/cm2 Light Intensity - Exeter 2016 - BBa_K1914003
We improved characterisation of KillerRed by exposing cultures expressing the protein to previously untested light intensity. We compared the phototoxicity of KillerRed to the commonly used Red fluorescence protein (RFP). Once we had established the efficiency the kill swtich, ministat chambers were inoculated with samples of E.coli BL21 (DE3) with the plasmid coding for the protein to determine the robustness of the kill switches over time.
The samples were tested for phototoxicity by exposing them to 12 μW/cm2 white light from a 4x8 LED array for 6 hrs. Samples were then spread plated and colony forming units (CFUs) were counted. The part was carried on the pSB1C3 plasmid and transformed into E. coli BL21 (DE3). Samples that were induced were done so with Isopropyl β-D-1-thiogalactopyranoside (IPTG) to a final concentration of 0.2 nM.
We constructed a box around the LED array to prevent ambient light entering, and attached acetate colour filters to provide the desired excitation frequency. Access to the inside of the box was gained through an opening cut in the front. With help from Ryan Edginton, we used a portable spectrometer (Ocean Optics USB2000+VIS-NIR-ES, connected to a CC3 cosine corrector with a 3.9 mm collection diameter attached to a 0.55 mm diameter optical fibre) to measure light spectra and absolute intensity in the visible range.
The graphs below show the average percentage of viable cells for induced and uninduced samples after 6 hrs of exposure to 12 μW/cm2 of white light. CFU count for the control condition was treated as 100 % and viable cells calculated as a proportion of that value. CFUs were not counted above 300, any lawns were assigned the value of 300. Error bars represent the standard error of the mean. The average temperature in the light box was 38.63 °C.

Percentage viable cells after 6 hrs in the light box. BL21 (DE3) transformed with KillerRed (BBa_K1914003) is compared to a control with no plasmid. 10 ml falcon tubes containing 4.5 ml of sample were placed label down in the light box to allow maximum exposure to the light.

Percentage viable cells after 6 hrs in the light box. BL21 (DE3) transformed with KillerRed (BBa_K1914003) is compared to a control with no plasmid. 10 ml falcon tubes containing 4.5 ml of sample were covered in tin foil before being placed in the light box.
Continuous Culture for KillerRed Kill Switch - Exeter 2016 - BBa_K1914003
We further characterised this kill switch by growing the culture in a ministat and carrying out the same testing procedure, illuminating induced cultures 24 hours after induction with100μM of 0.1M IPTG in the light box for 6 hours. CFU’s were counted to determine if the kill switch was successful in cultures grown in the ministat for 120 and 168 hours to test how long the kill switch remains functional.

Comparison of CFUs formed by KillerRed exposed to light and kept in the dark for each sample taken from the ministat. The efficiency of the kill switch decreases over time as shown by the increasing number of CFUs.

